Online Tools for Weather Information
Dakota Wagner, David Godwin, Christian Fernandez
Originally Written by: Jennifer Fill, Raelene Crandall
Publication ID: Fact Sheet 2025-3 Published: 2018 Revised: 2025, 2026
(View PDF)
Weather plays a pivotal role in shaping fire behavior. Before ignition, factors such as precipitation and relative humidity affect fuel moisture, influencing how readily fuels will ignite. During a fire, shifts in temperature and wind speed can alter fire intensity. Post-burn, atmospheric conditions like mixing height and transport winds determine how smoke disperses, impacting air quality and visibility. Understanding these weather variables is essential for planning and managing safe and effective fire operations. Access to accurate and up-to-date weather data is important for burn managers to make informed decisions about burn planning, including identifying optimal burn windows, selecting ignition strategies, and planning mop-up. This fact sheet highlights three commonly-used web-based tools designed to help burn managers retrieve and visualize weather information: the Fire Weather Dashboard, National Weather Service (NWS) GIS Viewer, and Fire Weather Intelligence Portal.
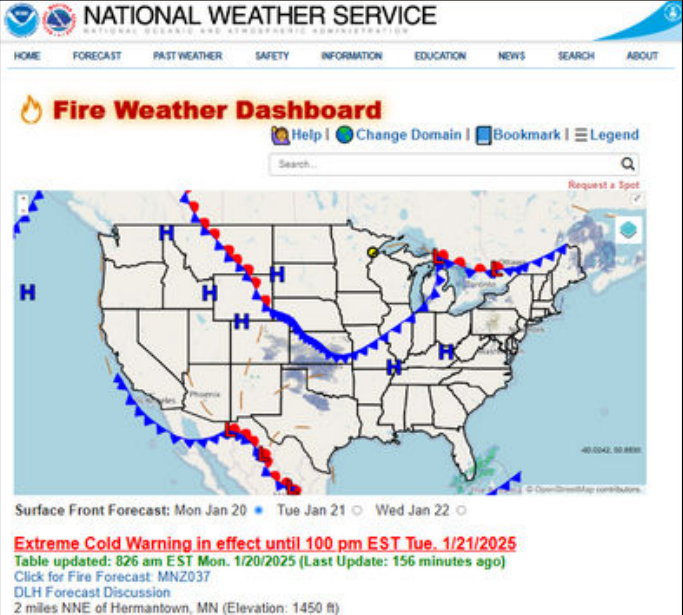
Fire Weather Dashboard
https://www.weather.gov/dlh/fwd
The NWS Fire Weather Dashboard is a useful resource for monitoring short-term fire weather conditions, providing detailed forecasts from the current date to seven days in advance. Hourly forecasts are available for the current day and the following day. Users can access data on wind speed, humidity, temperature, and precipitation, as well as hazard warnings (e.g. tropical storm advisories), radar, and satellite imagery. The Dashboard is the simplest of the tools mentioned in this factsheet, as it only requires users to select the location of their burn unit and will automatically produce all weather data in charts and graphs. Users can, if they desire, use the Overlay tool to observe current spatial data such as surface fronts or active wildfires in the map feature. This tool is especially useful for determining burn windows and ignition timing.
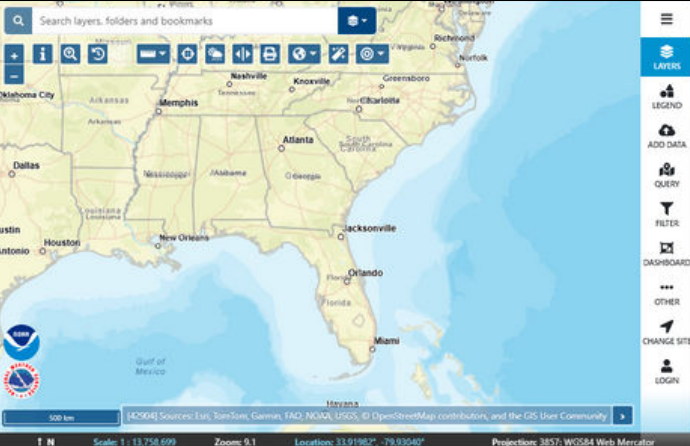
National Weather Service GIS Viewer
https://viewer.weather.noaa.gov/
The NWS GIS Viewer provides weather, water, and climate forecast data for a variety of users. Unlike the Fire Weather Dashboard, the Viewer allows users to upload their own data layers, such as burn unit polygons, to be used in tandem with the general map data. The Viewer integrates real-time and static datasets into a single interactive map, allowing users to visualize how current weather is impacting their specific area. Features include: radar, surface weather observations and analysis, satellite imagery, and forecasts and outlooks for weather-related events such as tropical storms and wildfires. Additionally, there is an experimental version of the Viewer specifically tailored for fire weather that automatically includes layers that may be useful for burn managers (see Additional Resources section. For additional information, download the NWS GIS Viewer User Guide (see Additional Resources section).
Fire Weather Intelligence Portal
https://products.climate.ncsu.edu/fire/
The Fire Weather Intelligence Portal, produced by the North Carolina State Climate Office, is a user- friendly interface that displays customized weather and climate data for the Southeast on a web browser-based map. The Portal allows users to model fire weather using past conditions, current conditions, and future (forecast) conditions in three separate maps for their specified location. The Current Conditions map will show the weather for the most recent hour up until 15 minutes past the
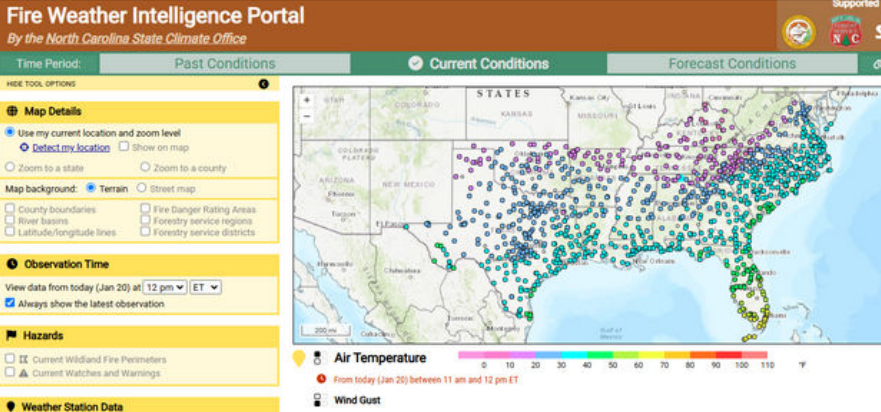
next hour. Past Conditions maps will show weather for a selected date and time (“Observation Time”) between 1/1/2002 and the present. The Forecast Conditions map displays future weather conditions up to seven days from the current date.
In each Condition map, users can observe a variety of weather-related data at specific points on the landscape or as gridded spatial overlays. Point data include observations at specific weather stations (e.g., precipitation, humidity, wind speed), as well as daily fire danger indices (e.g., KBDI) and fuel moisture conditions. Gridded/spatial data include weather conditions (e.g., precipitation radar) and spatial products related to wind speed, drought, and soil moisture. For burn units in North Carolina, there are additional datasets that can be viewed (e.g., soil parameters). In the Forecast Conditions section, users can view dispersion forecasts (e.g., ventilation rates and transport wind speeds) in addition to weather. For additional information, visit the Fire Weather Intelligence Portal User Guide (see Additional Resources section; despite being for an older version, the majority of the instructions remain relevant).
Conclusion
In summary, each online tool provides the capability to retrieve and visualize weather information. Table 1
offers guidance on selecting the most suitable tool for specific circumstances.
| Fire Weather Dashboard | NWS GIS Viewer | Fire Weather Intelligence Portal | |
|---|---|---|---|
| Location(s) Covered | National | National | Southeast |
| Time Period Covered | Current and 7-Day Forecast | Past, Current, 7-Day Forecast, and more | Past, Current, and 7-Day Forecast |
| How to Save Outputs | Bookmark link or download weekly summary as PNG | Download maps as PNG or PDF | Bookmark link |
| Strengths | Offers weekly weather forecasts alongside detailed hourly data, presented in both table and graph formats, requiring only location input for access. | Provides access to a very wide range of data and imagery, including satellite date, radar data, storm reports, real-time weather data, SPOT requests, hydrology, and severe weather forecasts. | The Portal's fully map-based design enables users to visualize data at both the burn-unit and landscape scales; and includes a broader range of time periods than other tools, which typically focus only on current and future conditions. |
| Possible Weaknesses | Not all data is represented on the dashboard map. | The interface requires some time and effort to understand and navigate, particularly when learning how to access and utilize the available datasets. | Applicability might be limited outside the Southeast, making it less useful for users managing burns in locations bordering other regions. |
Online Tool Access Links:
- Fire Weather Dashboard https://www.weather.gov/dlh/fwd
- NWS GIS Viewer https://viewer.weather.noaa.gov/
- Fire Weather Intelligence Portal https://products.climate.ncsu.edu/fire/
Additional Resources:
- Experimental NWS GIS Viewer for Fire Weather https://viewer.weather.noaa.gov/fire
- NWS GIS Viewer User Guide https://viewer.weather.noaa.gov/assets/Viewer_Basic_User_Guide_Nov2024.pdf
- Fire Weather Intelligence Portal User Guide https://climate.ncsu.edu/fire/guide/
- SFE Maps and Weather Tools Page https://southernfireexchange.org/models-tools-apps/maps-weather/